Modeling Patch Suitability in a Habitat Mosaic:
Exploiting Marginal Patches, Stabilizing Populations, and Reducing Interspecies Overlap
Introduction
Model for plant/herbivore interactions
Stability analysis of two-plant model
Multiple plant model simulation and analysis
Non-random oviposition
Graphical model
Summary
Table 1. Symbols appearing in text, with definitions
Table 2. Competition and coexistence in a Passiflora/herbivore community.La Selva .
Figure 1. Phase plane diagram - simple model
Figure 2. Two-plant simulation of plant-herbivore interaction
Figure 3. Phase plane diagram for logistic plant growth
Figure 4. Simulation of 10-plant interaction
Figure 5. Marginal plant productivity in 10-plant model
Figure 6. Relationship between xm and μ/b
Figure 7. Shape and position of the marginal peak
Figure 8. Equilibrium population densities
Figure 9. Quantitative graphical model for Heliconius-Passiflora interaction
Appendices:
Appendix I. Stability analysis of two-plant model
Appendix II. Stability analysis on two plant model with logistic plant growth limitation
Appendix III. Derive the estimated distribution of production of new herbivore adults by plants.
Appendix IV. Approximate distribution of herbivore production and foraging preference model derivations
Appendix V. Derivation assistence text equations.
Introduction Populations of consumers are frequently controlled by the availability and dispersion of renewable resources (Caughley and Lawton 1981, Dempster 1983, Kareiva 1983). Resource availability is often strongly influenced by the presence of predators (Hairston et al 1960, Hassell 1978), by weather (Strong 1984, Kareiva 1983) and by other qualities which may affect herbivore success, including chemical constituents, nutritive quality, and resource dispersion. In general, variability in resource availability reduces consumer fitness by (1) reducing the probability that a given consumer will encounter resources that it can successfully consume (Whitham 1983, Schultz 1983, Kareiva 1983), and (2) by preventing the evolution of a single consumer genotype which can severely damage the resource population (Hare 1983). The effect of variability on evolving populations of insect consumers has been modeled (see Mitter and Futuyma 1983, Gould 1983 for reviews). However, the effect of this variability on populations in ecological time has not been explicitly modeled.
In this paper I use the example of an insect herbivore consuming host plants in a diverse rainforest environment as a model system for exploring the mosaic nature of a consumer/renewable resource relationship. Using simple assumptions about plant growth and consumer survival/reproduction in a suitably complex environmental mosaic, I am led to the conclusion that consumer populations will be successful on small subset of mosaic patches in the habitat and will be unsuccessful elsewhere. Plants in the patches most favorable to the consumer will be overconsumed and will vanish from the mosaic. Plants in the least favorable patches will be unsuitable to the extent that consumer survival and reproduction do not take place. These plants will grow without regard to herbivory by the consumer, but will be limited by other factors in the environment. In between are the "marginal" patches where consumer fitness is adequate for plant and consumer coexistence. If we quantify this fitness as R, simulations and analysis presented below predict that 90% of the consumers will be produced by the subset of plants with fitness within ½ order of magnitude of R. Within this marginal subset of mosaic patches, the relationship is stabilized by the selective defoliation of the R+ plants and refoliation of the R- plants. To the naïve observer, unaware of the environmental mosaic, the plant population appears relatively unaffected by consumer fluctuations. This leads to the false conclusion that density-dependent population regulation is non-existent. In fact, the consumer has exerted strong selection on the host plant population by removing individuals from the population. In addition, there is a strong stabilizing force keeping consumers in the system, including overlapping species if they differ in patch requirements.
Although most authors do not report within- or between-plant variation in herbivore survivorship, available data suggest that the variability may be very great. Alstad and Edmunds (1983) have shown that artificially transferred colonies of pine scale insects have very low survival (less than 1% of colonie become established) on individual pine trees other than the one they were removed from, and Whitham (1983) showed that the fitness of Pemphigus aphids ranges over an order of magnitude between different host tress and between different branches of the same tree. Denno (1983) reported large differences in population density of Prokelisia leafhoppers as being a response to local variability in nutritive value of Spartina foliage. These studies suggest that plant quality, as measured by herbivore fitness or survivorship, may frequently vary over a range of 1-2 orders of magnitude or more. In general, variability of this magnitude will result when one portion of a plant population is effectively resistant to herbivore attack while another portion is vulnerable. If this variation is spatially restricted, as in many of the examples above, we can define the distribution as an habitat mosaic.
Survival of herbivores on plants is frequently found to be dependent on the presence or absence of ants (Messina 1981, Buckley 1982, Laine and Niemela 1980), and Smiley (1986) has shown that spatial variation in attendance to the extrafloral nectar glands of Passiflora results in differences among plants in the average suitability for herbivores, ranging from 40% to 90% daily survival rates of Heliconius caterpillars. Other herbivores require the presence of certain species of ants. Pierce and Elgar (198?) and Smiley et al (1987) found that the fitness of caterpillars of the Lycaenid butterfly Jalmenus evagoras was zero unless Iridomyrmex anceps was present, and Atsatt (1981) showed that females of another Lycaenid Ogyris amaryllis require ants for oviposition. These examples suggest that spatial variability in the predator community may be as important to herbivore success as other sources of variability discussed in Denno and McClure (1983). Many predators are not uniformly distributed in space, and, although little data is available, the vulnerability of herbivores on plants is likely to be affected by the plant’s location in the habitat with respect to factors such as the nests of ants (Bartlett 1961, Laine and Niemela 1980, Leston 1978), microhabitats sutable for spiders (Robinson 1981), lizard foraging ranges (Schoener 1970), other plants (Atsatt and O’Dowd 1976), or nests of birds, wasps, and other predators. Spatial variation in the average distribution of predators may be described as a “predator mosaic”, in which areas or “patches” of the mosaic differ in the composition of the local predator community. This definition focuses on spatial heterogeneity rather than territorial interactions between species, which are used to define the analogous “ant mosaic” (Leston 1978, Jackson 1984).
Since host plant nutritive and chemical quality will usually be independent of the predator mosaic, the effects of the two sources of variability will be approximately multiplicative. For example, if each source of mortality independently caused herbivore survival to range over two orders of magnitude, then the combined effect would range over 4 orders of magnitude. A habitat with such an extreme level of variability I termed a "wide-spectrum" habitat mosaic. In general addition of new sources of variability will tend to increase this range in a multiplicative fashion unless there are compensating interactions among the factors. This could occur if mortality caused by one agent increases in response to a decrease in another agent, such as in the case of two predator species interfering or competing with each other (Otto et.al. 2008), or when mortality is a rapidly increasing function of the density of the herbivores. In theory, an “optimally” foraging predator should act as a compensating agent of mortality, since it should selectively feed on prey in a density-dependent fashion (Hassell 1978), “culling” aggregations of herbivores on plants which are otherwise poorly defended. However, Morrison and Strong (1980), Dempster (1983), Strong (1984), and Kareiva (1983) reviewed the effects of predators on insect herbivores under natural conditions, and concluded that density-dependent predator responses were rare. This suggests that herbivores on plants with an ineffective predator community or other form of defense usually not be culled by compensating predation. Since most other forms of mortality are unlikely to interact with herbivore density (at natural densities), variation among plants in nutritive, chemical, microclimatic, and “predator” quality will probably result in large-magitude variation in the expected probability of herbivore survivorship on that plant.
In this paper I begin by analyzing the stability properties of a simple system consisting of a consumer herbivore population and two categories of resource plants, and then proceed to analyze multiple-plant systems using computer simulation and algebraic arguments. From this I develop a graphical analysis and analyze examples from my own research. Finally, I discuss some of the implications of the models for understanding the interaction between plants and herbivores.
Model for plant/herbivore interactions
First I model the interaction between host plant biomass (renewable resource) and population numbers of insect herbivores (consumers) over a short time scale (Caughley and Lawton 1981), and do not include plant reproduction by seeds or propagules. This initial model assumes plants are homogeneous with no habitat mosaic.
I assumed that changes in plant size, number of leaves, or biomass (s) may be modeled as plant growth rate (rs) minus herbivory rate (H), expressed as:
ds/dt = rs – H (1)
Because we are investigating spatial patchiness for an insect herbivore consumer that moves between patches, I need to distinguish within-patch resource consumption from off-patch variables such as consumer birth and death rates. To do this I envisioned the following: Changes in the number of mobile adult insect herbivores (n) may be modeled as the rate of production of new adult herbivores (H/p, where p is the amount of plant material required to produce one adult herbivore) minus the death rate of adult herbivores (nμ):
dn/dt = H/p – nμ (2)
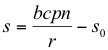
Finally, I assumed that the rate of herbivory (H) is determined by:
H = nbcp (3)
Where n equals the number of adult herbivores, b equals the herbivore per capita birth rate ( = egg production rate for most insect herbivores), c equals the probability that newborn herbivores survive to adulthood on the host plant, and p is the amount of plant material required to produce one adult herbivore. “c” is thus the parameter which expresses the suitability of plants for herbivore growth and survival. Table 1 lists these terms, with definitions.
Equation (3) for this initial model assumes that juvenile herbivores have an equal chance of survival on all plants (c), i.e. that plants are homogeneous. Substituting equation 3 into equation 2 it is easily seen that the herbivores must undergo exponential decline or growth, depending on the sign of (bc – μ) and the availability of host plant.
Plants which are effectively protected against herbivory cannot grow indefinitely. I assumed they could grow to some maximum size s0 , beyond which growth ceases. I incorporated this into the model as exponential plant growth, up to a size cutoff at s = s0 :
r = r0 (constant) for s < s0 , r = 0 for s > s0 (4)
or, alternatively, as logistic plant growth:
r = r0 ( 1 – s/s0) (5)
where r0 is the “maximum” growth rate for small plants. Equations (4-5) represent extremes and probably bracket more realistic functions which would have growth rates decline rapidly but not abruptly near s = s0 .
With either equation (4-5) combined with the model in equations (1-3), herbivores always decline to zero (except for the unlikely case when bc = μ). This happens because when bc > μ, herbivores increase until the plants are defoliated, after which the herbivore population “crashes”, i.e. declines to zero. When bc < μ, the herbivores decline immediately to zero. These models incorporate very simple assumptions about the interaction between plants and insect herbivores, and are highly unstable.
In order to provide more interesting models, Noy-Meir (1975) and Caughley and Lawton (1981) made additional assumptions about the effects of plant and herbivore density. Their models are most applicable to vertebrate grazing systems, which exhibit measurable density-dependent effects. As discussed above, populations of insect herbivores in natural systems typically do not exhibit measurable density-dependent components at most densities. Strong (1984) and Dempster (1983) have suggested that most populations of insect herbivores are not regulated by density-dependent effects except when they occasionally reach high densities, defoliating their host plants. I have followed this reasoning in the present work, and do not explicitly incorporate density-dependence into the equations for herbivore numbers.
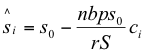
Instead, I incorporated heterogeneity among plants in herbivore survivorship by assuming that the patchy habitat mosaic contains n categories of plants (1,2,3…i...n), each with biomass si and probability of juvenile herbivore survival ci. I assumed that ci is a constant for each plant by virtue of the mosaic patch in which it resides, and that two plants with the same ci are identical in terms of the model and may be treated together. In this way I assigned each host plant within a habitat to plant categories based on the suitability of those plants for survival of the juvenile herbivores. Equations 1-3 then take the form:
![]() (6)
(6)
![]() (7)
(7)
D(i) is a function which distributes newborn herbivores (eggs) across the host plants. I initially assumed that the distribution was random with respect to foliage biomass, i.e. that each unit of foliage biomass has an equal opportunity of receiving eggs. In that case,
![]() (8)
(8)
where S equals the total biomass of all plants summed together.
Equations (6-8) require that the value of ci be equal to juvenile survivorship, and that all surviving herbivores are identical. If juveniles die in the pupal stage or otherwise after leaving the host plant (with survivorship probability Q), the additional mortality has the effect on increasing the average amount of plant biomass (p) required to produce one adult herbivore (p = p’/Q, where p’ is the amount of host plant consumed by one surviving herbivore). If adults are not identical, but have fecundity or adult survivorship influenced by the host plant (Rausher 1983), another function would be required in equation (7). I have not modeled such functions in the present work.
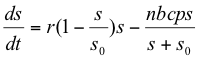
Stability analysis of two-plant model To investigate the qualitative stability of the model in equations 4-6, I analyzed a two-plant model in which plant 1 has few predators and conditions are favorable for herbivore increase but plant 2 has a highly effective defense and c2=0. In such a case s2 increases to maximum size s0.
 (9)
(9)
![]() [s2 = s0] (9a)
[s2 = s0] (9a)
 [c2 = 0] (10)
The zero isoclines of model 9-10 were found by setting equations 9 and 10 equal to zero and solving for s (letting s1=s and c1=c):
 [plant growth isocline] (11)
 [herbivore population isocline] (12)
A positive equilibrium can only exist if (bc-μ) > 0, i.e. per capita production of new adults (bc) must be greater than the per capita death rate μ This means that the herbivore must be able to increase when feeding on the most favorable host plants in the habitat.
To evaluate the behavior of the model away from equilibrium the sign of equations 9 and 10 were evaluated at various points in the phase-plane (see Figure 1). As with most predator-prey models (May 1981) the point trajectories were found to move tangentially around the equilibrium point, suggesting that the model is oscillatory. The angle of crossing of the isoclines also suggested that the system is unstable, using the method of Rosenzweig and MacArthur (1963). However, the signs at n ≈ 0 and s >> 0 indicated that as n approaches zero, the decline in herbivore numbers is slowed without affecting the increase in s, allowing both the plants and herbivores to recover. Likewise at s ≈ 0 and n >> 0 the decline in plant size is slowed while n continues to decline, allowing the plants to persist until the herbivore population becomes rare enough that the plants can recover. Thus, although the equilibrium point is apparently unstable, the system appears to be protected against either s or n collapsing to zero.
A stability analysis around the equilibrium point:
 (13)
(13)
 (14)
(14)
revealed that the sign of the real part of the eigenvalues of the associated Jacobean matrix was positive for bc-μ > 0 (Appendix 1). This means that the model is unstable near equilibrium, confirming the result of graphical analysis. Computer simulation revealed that plants and herbivores in model 9-10 oscillate in cycles with increasing amplitude (Figure 2; solid line). A global stability analysis of model 9-10 revealed that the cycles increased indefinitely when bc > r+μ, but were finite in number when bc < r+μ (Y. Iwasa, personal communication). In the latter case, the suitable plants and herbivores grew indefinitely after a finite number of cycles.
Plant growth limitation was not imposed on the suitable host plant in the above model. The effect of the plant growth ceiling (equation 4) was to impose a limit cycle on the otherwise diverging system, as shown by computer simulation with the dashed line in Figure 2. Incorporating the logistic plant growth model (equation 5) modifies equation (9) as follows:
 [r = r0 in 5] (15)
The plant growth isocline for this model (equations 10 and 15) was determined to be:
 [plant growth isocline] (16)
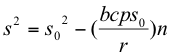
with the herbivore population isocline remaining unchanged (equation 11). When both isoclines were plotted as in Figure 3 and analyzed using the method of Rozenzweig and MacArthur (1963), the oscillatory nature of the model was seen to be preserved. However, the angle of the isoclines was changed so that the equilibrium point appeared by inspection to be stable. Stability analysis around the equilibrium confirmed this, with the real parts of eigenvalues always being less than zero for bc-μ > 0 (Appendix 2). The stable equilibrium points were:
 (17)
(17)
 (18)
(18)
Computer simulation incorporating logistic plant growth revealed cycles of decreasing amplitude converging on the equilibrium points, as predicted by stability analysis (Figure 2, dotted line).
This analysis of the two-plant heterogeneity models (equations 9,10 and 15) revealed that they have very different stability properties from the analogous models without heterogeneity (equations 1-5). In heterogeneous systems, herbivores cycled in abundance or reached an equilibrium with the host plant population. When vulnerable plants become rare, the herbivores begin exploiting the protected plants. Herbivore production then declined at the same time as the plants began to recover. This model behavior is similar to other types of models in which density-dependent effects have been explicitly formulated to allow plants and herbivores to recover when rare (e.g. Caughley and Lawton 1981).
Multiple plant model simulation and analysis
In nature, multiple factors interact to determine the average survivorship ci of herbivores on a given host plant, and values of ci for different host plants probably lie along a continuous spectrum of herbivore survivorship probabilities. Since the effects of independent sources of mortality on survivorship are multiplicative rather than additive, and because values of ci are typically very small ( < 0.1) it is most useful to represent the the spectrum of plant suitability on a logarithmic scale (Varley 1975). I initially modeled 10 categories of plants which were uniformly distributed across a range of this spectrum. For example, the plants in the simulations in Figure 4 and Figure 5 have ci values equal to 0.003, 0.005, 0.009, …, 0.333 in a geometric (multiplicative) series. The range of these values encompasses estimated survivorship for Heliconius caterpillars feeding on Passiflora host plants with (p=0.006) and without (p=0.11) attendant ants (see graphical analysis below for more details). Other model parameters used initially were r = 0.05/day, s0 = 100 leaves/ha., b = 2 female eggs/day, p = 5 leaves, and μ= 0.07/day. These values correspond approximately to parameters estimated for populations of Passiflora and Heliconius species (Smiley 1978 and Mallet 1984), which maintain low-density populations in rainforest habitats in the neotropics (Ehrlich and Gilbert 1973). It is important to note here that, in spite of the parameter values being taken from nature, the simulations remain unrealistic in that they assume equal numbers of host plants in each suitability category ci. This limitation is addressed later in the graphical analysis.
Some of the plants represented in the multiple-plant model become defoliated (si ≲ 0), and since growth rate is proportional to size (equation 1), these plants cannot recover. Since plants in nature typically have new seedlings and stored reserves which enable them to recover from defoliation, I incorporated a minimum plant size of 1.0 leaves into the simulations. This allowed plants to recover if the herbivores were not too numerous, but did not otherwise affect the outcome of the model. I assumed that these “reserve” leaves were unavailable to the herbivores, as would be the case if their biomass were in the form of stored reserves rather than actual foliage.
When simulated with the plant growth cutoff model (equation 4), the 10-plant system converged to a limit cycle of small amplitude (Figure 4, solid lines). The three most suitable plants (8-10) became defoliated at equilibrium, while the six least suitable (i.e. the six best-protected plants 1-6) grew to full size (Figure 5, top). Plant 7, the “marginally suitable” plant, cycled in size with the herbivore population, which also cycled with small amplitude. When simulated with the logistic plant growth model (equation 5), the system came to a stable equilibrium (Figure 4, dotted line). The three most suitable plants were nearly defoliated, and the 4-5 most protected plants grew to large size (Figure 5, bottom). Plants 6 and 7, the marginally suitable plants, remained at stable, intermediate sizes. Thus, a similar pattern resulted from both models. The least suitable, best protected plants grew unhindered by herbivory, the most suitable least protected plants became defoliated and were unavailable to the herbivores, and the marginally suitable plants were only partially defoliated. This suggests that the marginally suitable plants support most of the production of herbivore adults, and constitute the principal host plant resource for the herbivore population at equilibrium.
To quantify which plants were producing most of the adult herbivores, I determined the position and breadth of the peak in herbivore production along the logarithmic axis of host plant suitability x = ln(ci). I first considered the logistic plant growth model, which converges to stable equilibrium. For this model, equilibrium plant sizes may be derived by modifying equation (15) for multiple plant categories, setting to zero, and rearranging (S = biomass of all plants, summed together):
 (19)
(19)
This is a linear function of ci and includes negative values of si when ci > cm. cm is defined as the value of ci for the marginal plant “m” (i.e. the x-intercept of the line in equation 19 or the curve in figure 5), where si = 0. Then, herbivore production P(i) by host plant i at equilibrium will be:
 (20)
(20)
Converting to the logarithmic scale and integrating (Appendix III), this function yields approximately 80% of herbivore production by plants positioned along the axis of plant suitability within 2.3 natural logarithm units of xm, where xm = ln(cm).
Similar calculations using the plant growth cutoff model revealed that over 90% of herbivore production occurred within 2.3 log units of xm (Appendix IIIB). This is an overestimate, since I assumed that the sizes of the “marginally suitable” plants have size s0 when in fact they cycle in size. Cycling should tend to spread herbivore production over more plants. However, the simulations show that this effect is small (Figure 5, top). Thus, a relatively small subset of host plants (within a span of 2.3 ln units along the axis of plant suitability) contributes 80-90% of the production of new herbivores to the population. This is an important result because it greatly narrows the selection of relevant mosaic patches to the few that are producing herbivores.
I now turn to some of the model parameters to exarmine the robustness of the above findings.
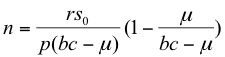
The value cm determines which plants become defoliated and which plants produce most of the herbivore population. To determine how model parameters such as herbivore birth or death rates and plant size might affect cm at equilibrium, I let the herbivore death rate be equal to the to the total herbivore production rate. This yields an approximation (Appendix III-E):
 (21)
(21)
with cm as defined above, S equals the total plant biomass at equilibrium, and ![]() , with W being the interval along the x-axis included within plant category i. Note that “W” is the “width” of each category i, and is approximately 0.5 [=ln(1.7)] for the models in figures 4 and 5. This is a way of scaling the discrete plant categories 1,2,3…i…n to a continuous distribution with units of x. This conversion allows mathematical integration along the x-axis, which is needed for combining across multiple plant categories.
, with W being the interval along the x-axis included within plant category i. Note that “W” is the “width” of each category i, and is approximately 0.5 [=ln(1.7)] for the models in figures 4 and 5. This is a way of scaling the discrete plant categories 1,2,3…i…n to a continuous distribution with units of x. This conversion allows mathematical integration along the x-axis, which is needed for combining across multiple plant categories.
Equation (21) may be solved for cm or xm, respectively:
 or
or ![]() (22)
(22)
The inverse of μ/b is equal to the oviposition rate times the expected lifespan of a newly eclosed adult (1/μ). This ratio should be sensitive to changes in the habitat of the adult herbivores, since factors such as plant spacing, predators, and weather conditions which increase b are likely to reduce μ, amplifying the effects. In contrast, S/sx should be relatively stable, since environmental factors which decrease S, the total plant biomass, should also decrease sx, a subset of the total plant biomass. The equations above suggest that variation in the μ/b ratio is likely to alter the position of xm in the model, without affecting the width of the peak in herbivore production.
I modeled these predictions using the 10-plant simulation model with logistic plant growth. As illustrated at the bottom of Figure 5, over 75% of the production of new herbivore adults was produced by plants 4-7, a “span” of 4 plant categories. The value of x (x=ln(ci)) increased by 0.5 in each successive category, which, added together, gave an overall span of 2.0 between the highest and the lowest value. This corresponds almost exactly to the values predicted in Appendix III. Simulating the plant growth cutoff model resulted in about 90% of the herbivores being produced within a span of 2.0, also as predicted.
I also simulated the effects of changing the model parameters found in equation (22). I simulated changes in the μ/b ratio for a system in which cmin=0.001 and cmax=1, with other parameters remaining the same. Large changes in the μ/b ratio caused only minimal changes in the sx/S ratio (range .48 to .20). In Figure 6, I plotted xm, the log suitability of the marginal plant, as a function of the μ/b ratio. As predicted by equation (22), xm varied in proportion to μ/b. The simulations revealed that equation (22) accurately predicts equilibrium values of the model.
The form of equation 18 suggests that the equilibrium number of adult herbivores (^n) is directly proportional to plant productivity (rs0). I tested this by varying rs0 from 0.5 to 50 in the 10-plant simulation and found that ^n remained in exact proportion. Since plants with values of ci near cm produce most of the population herbivore adults, I reasoned that the productivity of these specific plants actually determined the number of adult herbivores. To test this, I altered plant growth rates r(i) so that plant productivity r(i)s0 declined as x increased. I then manipulated μ/b to “move” the marginal plant along the x-axis. As predicted, ^n rose and declined in proportion to the changes in plant productivity subsumed by the peak in herbivore production, but was independent of the productivity of other plants.
In summary, the multiple-plant models suggest that systems with random oviposition and plant populations which are smoothly heterogeneous tend to be stable, with herbivore production primarily determined by the productivity of a set of “marginally suitable” host plants. These plants range in their suitability for herbivore survival over about one order of magnitude, i.e. by a factor of 10. For such models, when a pulse of herbivores over-consume their food supply, they are forced to decrease their use of the most suitable plants where they have the best survivorship. The assumption of random oviposition (equation 8) ensures that the use of low-suitability plants will thereby increase, lowering the mean fitness of eggs and ultimately reducing the population of adult insects. However, since many herbivores do not select among their food plants at random (Rausher 1983), I also examine the consequences of non-random oviposition.
Non-random oviposition
I simulated the effects of non-random oviposition using the 10-plant simulation models. I first simulated a “perfect forager” which could accurately locate plant foliage with the highest value of ci, deposit just enough eggs to defoliate it, locate the next best plant, oviposit, and so on, until full egg complement (bn) of the population of adult herbivores was depleted. These simulations resulted in patterns similar to those in figures 4 and 5, except (1) plants which were partially defoliated in the random oviposition model became completely defoliated and (2) the position xm ( = ln(cm) ) of the marginal plant along the x-axis moved to the left toward reduced values of plant suitability. Apparently, the ability to accurately locate and fully exploit the most suitable plants enabled the herbivores to defoliate plants with lower values of ci. At equilibrium, the small productivity of the “defoliated” plants produced most of the herbivore population, and the even the marginal plant was fairly unsuitable. The result was greatly reduced equilibrium herbivore production, in spite of a normal number of eggs being layed. This is shown in Figure 6, where xm < ln(μ/b), indicating that this plant alone could not could not support successful reproduction by the herbivore population. At this “perfect foraging” extreme the simulation has become unrealistic, since host plants which are consistently defoliated should lose reserves and die.
The above simulation incorporated the assumption that herbivores locate and accurately assess the suitability ci of each host plant in the environment. This is also unrealistic because, as discussed in the introduction, many of the aspects of host suitability are cryptic to the searching herbivore (see also Singer 1972). In particular, the distribution of some types of predators may not be apparent to searching adults. For example, Smiley (1978) and Longino (1984) reported that Heliconius butterflies do not preferentially oviposit on ant-free plants, in spite of their greatly reduced fitness on these plants (Smiley 1985 and 1986). Ants are conspicuous, slow-moving, and use extensive chemical communication. Other types of predators are likely to be far more cryptic to a searching consumer. As a consequence, even a very efficiently foraging herbivore is almost certain to occasionally oviposit on host plants with low values of ci, especially when the more suitable plants have been defoliated.
To model this intermediate possibility, I simulated a “preference” forager which has increased preference (PR(x)) for plants of higher suitability (higher values of x = ln(ci)), but nevertheless places some proportion of the eggs on plants with low values of x:
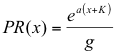 (23)
(23)
and
 (23a)
(23a)
Here, “K” equals –ln (cmin), ensuring positive values for all (x+K; x < xm), “a” is a preference coefficient with a = 0 indicating random foraging and a = 1 indicating preference directly proportional to ci, and “g” a proportionality constant ensuring that the total number of eggs laid remains the same. Note that (x + K) creates an axis beginning at -K along which x+K increases linearly with x, providing "preference" for higher values of x. For these simulations, (xm+K) usually had a value of about 6-7 (actually 5.9 for the simulations in figures 4 and 5, and 6.9 for Figures 6-8). Note that oviposition is also dependent on the amount of host plant relative to the total plant biomass sx / S; small or rare plants will receive fewer eggs.
Incorporating equation (23a) with equation (8) and using equation (19) for approximate plant size at equilibrium, the production of herbivores by plant i is approximately:
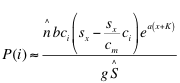 (24)
(24)
Integrating between –K and xm along the logarithmic scale (= total herbivore production), the ratio of herbivore production on plants within Z log units of cm to total herbivore production by all plants is (see Appendix IV for details):
![]() (25)
(25)
For a = 1, equation (25) predicts that 97% of the adult herbivores will be produced by plants with values of x within 2.3 log units of xm. Thus, for this degree of preference, the peak of herbivore production is narrower than that of a “random” forager with the same parameters. a=1 represents a strong degree of preference since approximately 90% of the eggs would be placed on the “best” three plants out of 10 if all plants were equally abundant.
Equations (23-25) do not incorporate the possibility, permitted in the simulations, that small “defoliated” plants produce herbivores. The values predicted by the equations therefore diverge from the simulations for extreme degrees of preference (a > 1). Figure 7 shows peaks of herbivore production for a=0,1,2,4 as predicted by equations (24). The peak for a = 1 is about 2/3 as wide as the peak for a=0.
As the width of the peak of herbivore production narrows, the amount of plant productivity subsumed by the peak should be correspondingly less, resulting in lower population densities for the herbivores. The results of simulations suggest that this is indeed the case. As the value of the preference coefficient (a) was increased, herbivore population density at equilibrium was seen to decline (Figure 8).
Equations 21-25 and the results of simulations in Figures 6 and 8 suggest that the primary effect of host plant preference discrimination is to narrow the peak of herbivore production, reduce the value of xm = ln(cm) (= the suitability of the marginal host plant) and to reduce equilibrium population density for herbivores. The reduced population density is primarily caused by defoliation of plants which were marginally suitable under random foraging. At high levels of preference (i.e. the ‘perfect forager” model, all plants may be defoliated which can sustain the herbivore population, and the herbivores subsist on the plants which are regenerating from defoliation or are newly recruiting.
To summarize, the multiple plant models and simulations have shown that having a continuum of host plants that vary in suitability over 2-3 orders of magnitude result in several robust conclusions. (1) An equilibrium will be established that includes a set of marginally suitable plants which support most of the herbivore production, (2) the marginally suitable plants will be those in which herbivore survival (cm) balances per capita reproduction (b/μ) adjusted for oviposition selectivity (<1-2 log units). (3) The marginally suitable plants and the slightly less suitable plants within 2.3 log units (one order of magnitude) along the suitability axis produce 75-90% of adult herbivore production, and their biomass and productivity determine the equilibrium herbivore population. (4) The identity of these marginal plants is a function of the particular set of predators (or other fitness factors) present or absent from the mosaic patches in which the plants are found; consumers sharing the same predators will come in strong, direct competition with each other. (5) Consumers that differ in predation vulnerability or other spatially patchy fitness factors will not directly compete, because their marginal plants will be found in different patches of the habitat mosaic.
Graphical model and applications
The multiple-plant models suggest a graphical model for plant herbivore interactions incorporating heterogeneity among plants in herbivore survivorship, as follows. Let the horizontal axis x of the graph be the logarithmic spectrum of host plant suitability for a given population of sessile herbivores such as caterpillars, and let the vertical axis be the amount of host plant (see Figure 9). Plot the distribution of plant biomass along the spectrum. Use the μ/b ratio and equations 20,24 and 25 to approximate the position of the marginal plant xm = ln cm along the x-axis. xm will usually be 1-2 log units to the right of μ/b along the x-axis. Hatch the area to the left of the marginal plant, going back 2.3 log units.( Z=2.3 for one order of magnitude decline in plant suitability for non-selective oviposition; use smaller values for a > 0). This hatched area represents the plants most likely to support herbivore production.
If not already known, the equilibrium (post herbivory) ^si may then be calculated from their position along the x-axis. Assume that the production of adult herbivores takes place on plants between xm and xm-Z, where Z ranges between 1 and 2.3 depending on the estimated preference function (a=1 or 0, respectively: see equation 23). To the left of xm-Z, the ^si will be equal to the values on the graph, between xm-Z and xm the values will decline toward zero moving to the right, and to the right of xm the si will be equal to zero.
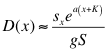
Once the equilibrium ^si are plotted on the graph (see Figure 9) the herbivore productivity (P) may be estimated. This will be approximately:
 (28)
(28)
where sx*Z/2 and r/2 are the estimated biomass and growth rates, respectively of plants between xm and xm-z which are 50% defoliated, on average. For the plant growth cutoff model, r0 should be used in place of r/2 but Z should be correspondingly reduced so I recommend using equation (28) in either case. At equilibrium, P/p (where p is the amount of plant biomass needed to produce one adult herbivore) will approximately equal the rate of production of new adult herbivores. This equals the population death rate nμ. Solving for n yields:
 (29)
(29)
For the simulations in Figure 8, r = .05 / day, μ = .07 / day, sx*Z was 133 and 89 for a=0 and a=1, respectively. Using equation (29), ^n equaled 9.5 and 6.4, respectively, which corresponds closely to the values in figure 8 (9 and 6, respectively). Below I analyze an example using this technique.
Smiley (1985, 1986), Smiley and Wisdom (1985), Longino (1984) and Mallet (1984) investigated species of Heliconius butterfly caterpillars which feed on species of Passiflora at Corcovado National Park in Costa Rica, Central America. Based on evidence from field studies of Passiflora vitifolia in Smiley (1985 and 1986), I calculated the probability of caterpillar survivorship over a four-day period to the full 12 days required for larval development. I assumed that the mortality rate does not decline as the larvae grow, supported by the data in Smiley (1985), but I did not include relatively infrequent forms of juvenile mortality such as egg and larval parasitism or predation. The majority of Heliconius larvae in these field studies belonged to two species H. pachinus and H. hecale, which I could not distinguish in the early stages. About 10% of P. vitifolia vines at the field site were ant-free, with an estimated caterpillar survivorship of 0.11 (x = ln(ci) = -2.2). The other 90% of vines were ant-tended, and averaged 0.0057 survivorship (x = -5.1). This average included some large, continuous patches of host plant with a mean survivorship of 0.00013 (x<-10). Ant-free plants tended to be small in comparison with ant-tended plants, and I estimated the distribution of biomass along the x axis to be that illustrated in Figure 9. I additionally represented the presence of large-biomass canopy foliage by a dotted line. This foliage is usually not oviposited upon by the species of Heliconius investigated, which prefer the small vines and understory portions of large vines (Mallet 1984). The methods in Smiley (1986) were not precise enough to determine the ci values for individual plants, and the actual spread in values of ci may be greater than that illustrated.
Gilbert (unpublished data) determined the local population density of Heliconius species in the “horse pasture” at the field site. Mallet (1984) estimated the total biomass of P. vitifolia in a five hectare patch of adjacent secondary forest to be 2000 leaves/ha. Since about 1/10 of this biomass lies in the herbivore-producing area of the graph (hatched area in Figure 9), and using equation (29) with r0 = 0.05/day, p = 5 leaves, and μ = 0.07/day, the estimated population density ^n for H. hecale was 7/ha., or 35 for the five-hectare area. This agrees well with actual estimates of population density for that site (^n ≈ 40, ranging from 10 to 100, depending on seasonal fluctuations; L. Gilbert, unpublished data). This analysis indicates that the model is capable of predicting realistic values of ^n from crude estimates of plant biomass and the birth and death rates of herbivores. It also indicates the importance of identifying the subset of host plants in mosaic patches capable of producing new herbivores; without this information the herbivore/host plant interaction would be difficult to measure or understand.
As mentioned above, one of the predictions of this theory is that consumer species may be able to coexist on the same host plant resource without direct competition, so long as they differ in their susceptibility to specific predators. Smiley (ms in prep) has investigated another community of Passiflora vines and insect herbivores at the La Selva Biological Station in northeastern Costa Rica. Here I discovered a rich community of Passiflora-feeding consumers cosisting of 10 species of Heliconius butterflies and 10 species of Passiflora-specific flea beetles. Extensive observation of adult and larval flea beetles as well as Heliconius revealed that the diversity of this community derived from five distinct groups of host plant species, each of which supported 4 "modes" of coexisting, overlapping herbivores: "subgenus-generalist" caterpillars found on more than one species of Passiflora, monophagous usually group-feeding caterpillars, leaf-feeding flea beetles and root/stem-feeding flea beetles. As can be seen in Table 2. Passiflora-feeding Heliconius and flea beetles at La Selva. each of the 20 "niches" in the table is filled by one species, and species that share the same host species are never from the same feeding mode (with one exception). This suggests strong competition within feeding modes, and relaxed competition between them. The most likely explanation is not that they are feeding differently (for example, three of the four modes eat new leaves) but that they are vulnerable to different predators. The "subgenus-generalist" Heliconius are most vulnerable to ponerine ants (Smiley 1985 and 1986) and the monophagous Heliconius to other ants and wasps. The flea beetles are less well-studied, but appear to be very resistent to ant and wasp predation. In contrast to Heliconius, they may avoid plants with higher quantities of cyanogenic glycosides, the amounts of which are highly variable between plants. These differences in life-history strategy may well account for coexistence by linking each successful strategy to different individual plants in the habitat mosaic. By contrast, strong competition may occur between members of the same life history group as their success depends on the same small subset of plants. This prediction is readily testable in that it predicts that different types of herbivores will be successful on different individual plants even though they share the same host plant species. See Smiley ("Species Diversity in a Wet Tropical Forest Food Web"; ms in prep.) for more information about this community.
Summary
The algebraic modeling, computer simulations and graphical analysis presented above suggest that heterogeneity among renewable resources (e.g. host plants) in terms of consumer fitness has profound effects on the interaction between consumers and their resources. With reasonable assumptions about plant growth, the presence of spatially defined habitat patches, encompassing a 2-3 order of magnitude spectrum of consumer fitness, is a sufficient condition for establishment of a robustly stable relationship between consumers and their resource plants. In general terms, that portion of the host plant population sited in patches resistant to herbivory provides a refuge for plant survival, while plants in patches more suitable for the consumer provides refuge for the herbivores. The presence of multiple, often independent agents of patch-specific mortality act to ensure that a continuum of survivorship probabilities will be established, further stabilizing the interaction. Although the habitat mosaic is created and maintained by the presence of spatially limited biotic agents, including plants, ant/wasp nests, lizard/bird territories, other animal homes, etc., it can be described and quantified in terms of fitness effects on the consumer species of interest. Methods such as those found in Smiley (1985b and 1986b) provide a beginning for measurement.
The relationship established is relatively insensitive to the selectivity of mobile adult consumer search behavior. The critical parameters that determine most of the properties of the relationship are the distribution of plant productivity or biomass along the spectrum of patch fitnesses (i.e. fitnesses of the consumer on the different patches), and μ/b, the ratio between the per capita death and birth rates for the population of adult consumers. A knowledge of these three elements is sufficient to crudely predict the distribution of plant sizes and the resulting numbers of adult consumers. A central finding is that 80-90% of the consumer population depends on small subset of the resource patches, namely those patches which yield fitness within one order of magnitude of the best existing "marginal" patch. Although the model is unrealistic in some respects, such as the assumption that consumers lay fractional eggs and that the juveniles feed and grow instantaneously, the application of the model to actual field populations suggested that the model can yield realistic quantitative values for some systems. At least the model provides a guide for examining effects of localized plant variability on consumer populations.
For resource-consumer systems such as those modeled here, a pulse in adult consumer population size does not result in an immediate increase to the death rates of on-plant juveniles. The increase in mortality only takes place after defoliation of the most vulnerable plants, forcing the herbivore population to use less susceptible hosts. Analysis of life-table data from individual plants or small plots in such a plant-herbivore system will reveal density-independent fluctuations, in spite of the fact that, as a whole, the population tends to return to equilibrium densities. This suggests that detection of density-dependence may rely on the scale of investigation.
Dempster (1983) and Kareiva (1983) cited numerous examples in which increases in the per capita μ/b ratio apparently caused an opposite response in herbivore populations. This relationship is intuitively reasonable as an immediate response to changing μ/b, but there is no obvious reason why long term responses of the population should reflect the μ/b ratio. Since many of the examples do involve long-term differences, there remains the question of why herbivores with increased μ/b ratio do not go extinct and why the ones with a reduced μ/b ratio do not defoliate their host plants. Dempster (1983) suggests that locally, such density independent events may be common, and Strong (1984) and Kareiva (1983) suggest that the dependence of population size on μ/b ratio may be real but difficult to measure. For some of these systems, the graphical model in Figure 9 may reconcile these points of view, since local extinction and defoliation occur on individual plants, yet increasing the μ/b ratio causes a decrease in population density at equilibrium. This happens because herbivores with high death rates and/or low birth rates can only subsist on the “tail end” of plant biomass that is unprotected from herbivory (far to the right on the axis of plant vulnerability), while herbivores with low death rates and/or high birth rates successfully exploit the relatively more numerous plants which are better protected.
It might be expected that increasing habitat complexity (such as architectural complexity, habitat specialization or predator diversity) augments the scope and definition of the “predator mosaic.” Patches may become more sharply defined as component species specialize, and multiplicative factors may become more dominant. The graphical representation of host plant suitability responds by widening laterally, with, on average, reduced plant biomass in each category. The overall effect will be to stabilize herbivore numbers at lower population densities. This reasoning suggests that the best place to look for habitat mosaics of the type proposed here may be in spatially complex habitats such as tropical forests or coral reefs.
The two examples offered above are Passiflora/herbivore interactions from wet tropical forest in Costa Rica. An interesting test of the habitat mosaic model would be to locate individual Passiflora vines and see which plants support successful herbivory by the different herbivore feeding modes. We already have seen the patchy nature of successful subgenus-generalist Heliconius larvae, but with few exceptions have not discovered the host plants for the other three modes. This would probably be most easily done by surveying Passiflora auriculata/biflora for larval H. erato, H. sara, Parchicola "DF2", and Ptocadica bifasciata (Smiley, ms in prep.) at La Selva. If our theory is correct, these species will tend to be successful on different individual plants.