Appendix 2. Gallery of 30 Passiflora cyanogenesis kinetics and branch profiles, arranged by species in alphabetical order.
All measurements employ "cup concentrator" method (see Appendix 1 for details) unless otherwise indicated.
|
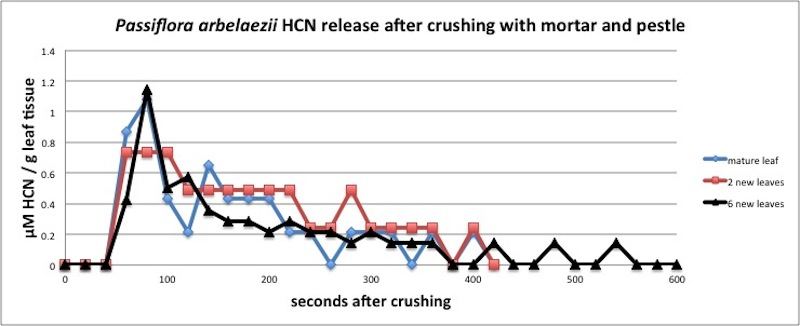 |
| Figure A1, above. P. arbelaezii reaction kinetics show a peak at about 80 seconds after crushing leaves in a mortar and pestle, followed by an exponential decay. Many Passiflora species have similar kinetics, including the ecologically similar P. biflora. Kinetics measured in closed container (see Appendix 1). |
|
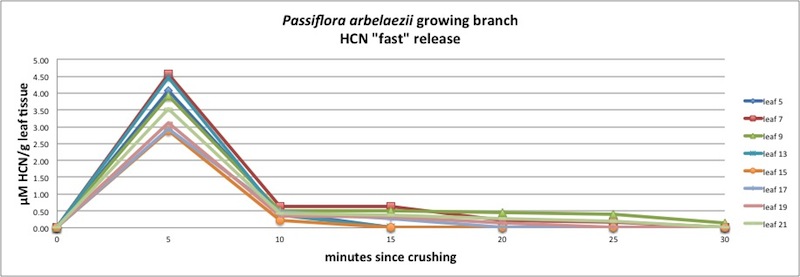 |
| Figure A2, above. P. arbelaezii HCN release over a longer time period. The "tail" of the curves after 15-20 minutes do not seem exponential. One possible explanation is that leaf crushing may be incomplete, so that a small proportion of the leaf material is less accessible to the β - glucosidase enzymes. The reaction is delayed until the enzyme can finally mix with the remaining cyanogenic glycoside. Incomplete crushing can easily occur because the samples must be handled rapidly so as to place them in the concentrating vessel before HCN can escape (see Appendix 1). |
|
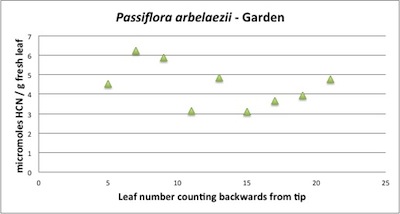 |
| Figure A3 above. P. arbelaezii branch profile showing consistently high amounts of cyanogenic glycoside. The type of cyanogenic glycoside is not known for this species, but it's ecological similarity with P. biflora suggests one compound may be the complex cyclopentenyl passibiflorin. |
|
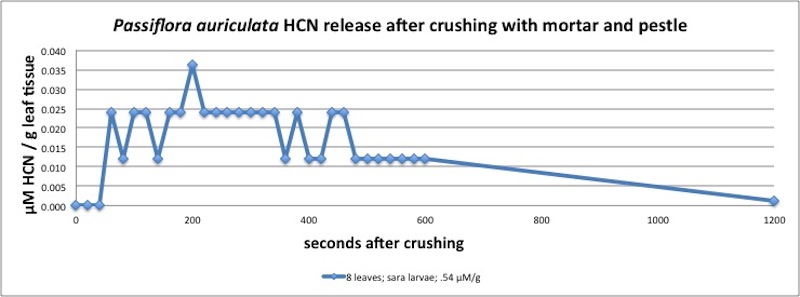 |
| Figure A4, above. The P. auriculata HCN kinetics show a peak at 200 seconds. P. auriculata typically produces only small amounts of HCN, making it difficult to measure with the instruments available; hence, the coarse resolution of the curve. Measured in closed container (see Appendix 1). |
|
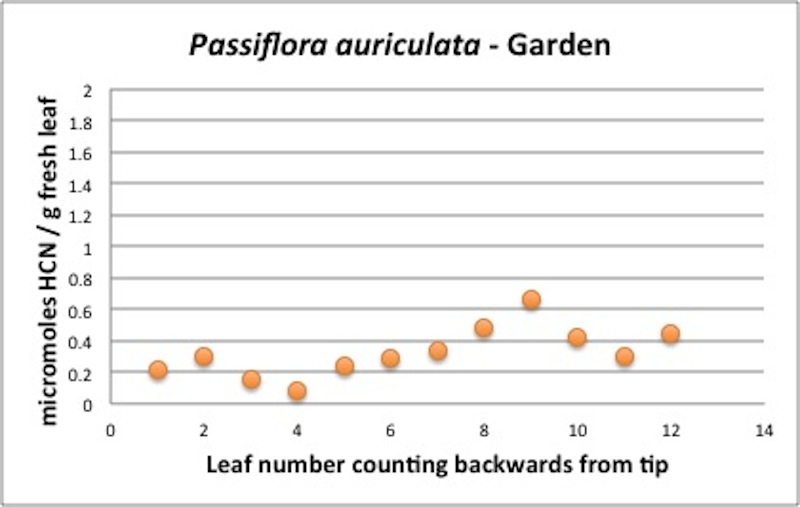 |
| Figure A5, above. P. auriculata branch HCN profile. Note the two peaks at leaf 2 and leaf 9. |
|
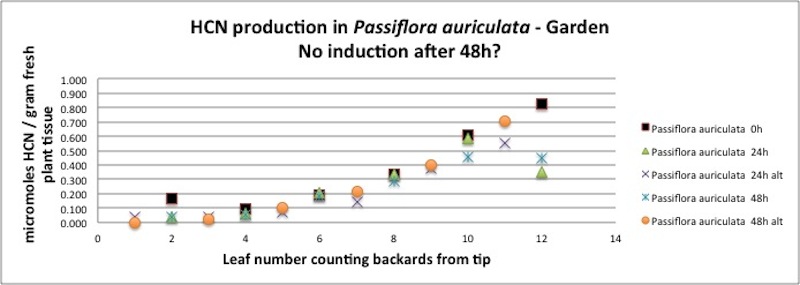 |
| Figure A6, above. P. auriculata branch, even numbered and odd numbered leaves sampled repeatedly over a two day period. At time t=0 the even numbered leaves were sampled by removing the distal 1/3 of the leaf, resulting in cutting damage to those leaves. All leaves were sampled after 24 to see if HCN quantity changed in the damaged leaves or the adjacent undamaged leaves. They were sampled again at t=48h to see if there were any slower changed. Nearly all the measured amounts fell on the same curve, suggesting no systematic changes occurred in response to cutting and removal damage. Similar tests of other species such as P. ambigua do show evidence if changing amounts of HCN in response to cutting damage (see below). |
|
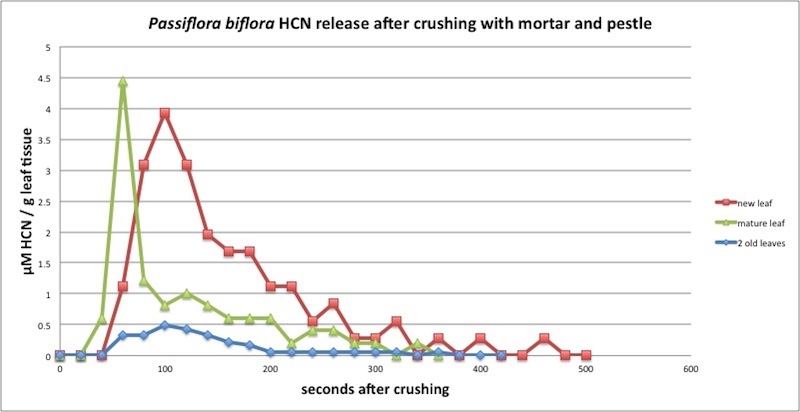 |
| Figure A7, above. Kinetics of P. biflora HCN production meausured every 20 seconds in a closed container. Note the peak at 100 seconds but also the unusually early peak by a mature leaf (green line). This should be repeated but this is the only measurement I have with such a fast HCN release. Measured in closed container (see Appendix 1). |
|
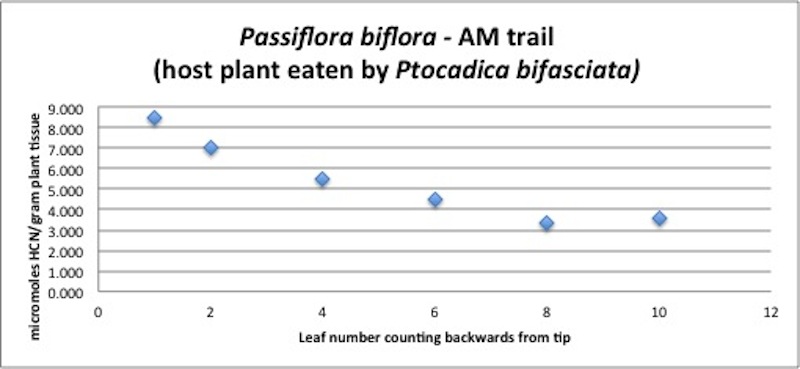 |
| Figure A8, above. P. biflora branch HCN profile. The newer leaves have higher concentrations of HCN by a factor of 2-3. Leaves increase in wet weight by approximately the same amount during leaf development; thus the changing concentrations could result from a constant amount of cyanogenic glycoside being "diluted" as the leaf grows. |
|
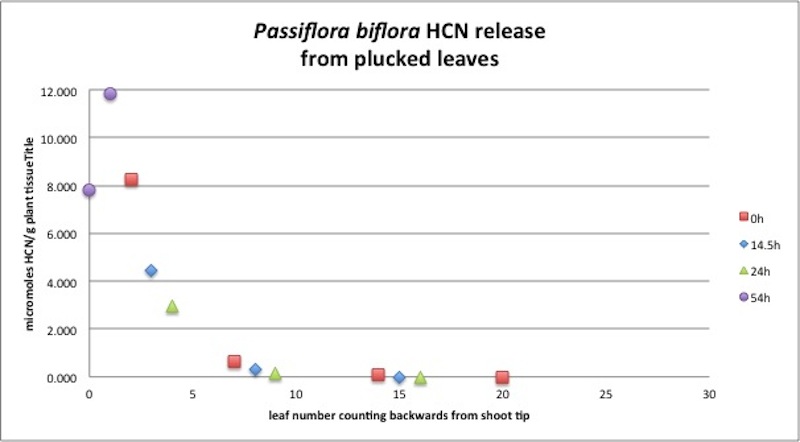 |
| Figure A9, above. This P. biflora branch profile illustrates a much more extreme drop in HCN production in the older leaves, as compared with the branch analyzed above in Figure A8. This slender branch was growing in the shade with small leaves, and the leaves may have been much older The first sample at t=0 was to pluck the red square leaves, with other leaves being sacrificed at the times indicated. Clearly, leaf damage in this case caused no change in the amount of HCN produced. |
|
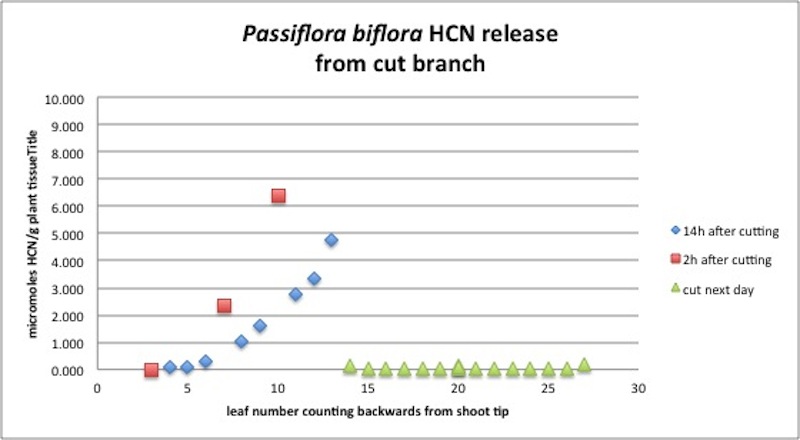 |
| Figure A10, above. This P. biflora branch illustrates unexpected complexities in these systems. I found this slender branch growing in the shade, and removed the branch by cutting its stem below leaf #14. I went back to the lab and analyzed 3 leaves right away (red boxes). I then set the branch on the lab table in a plastic bag so it wouldn't dry out, and then measured HCN for the remaining leaves (blue diamonds). Finally, I went back the next day and collected the rest of the branch by cutting its stem below leaf #27. I took this back to the lab and measured HCN in those leaves. It seems likely that this branch, to begin with, contained increasing amounts of HCN in mature leaves as opposed to new leaves, at least up to #13. Branch cutting also seems to have brought about a decrease of 50-60% in HCN amounts over a 12 hour period. Perhaps most surprising of all, the remaining uncut leaves (still on the plant) seem to have completely eliminated their capacity to produce HCN! Clearly, HCN production for this, and perhaps most, Passiflora species is under active control by the plant. |
|
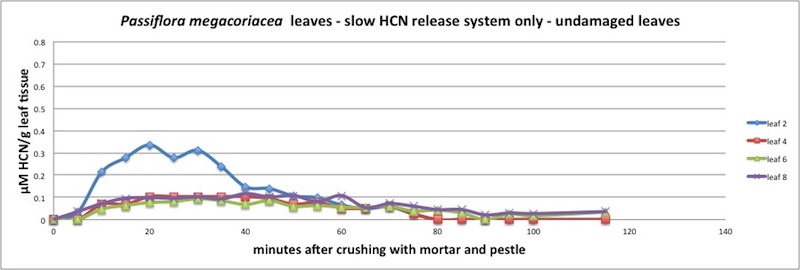 |
| Figure A11, above. Unlike other La Selva Passiflora, P. megacoriacea releases its HCN very slowly over a long period of time. Release seems to peak at about 25 minutes, with an exponential decay lasting 2 hours or more. Measured in closed container (see Appendix 1). |
|
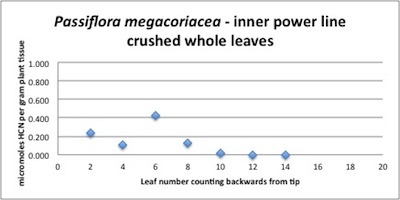 |
| Figure A12, above. In spite of its unusual HCN release kinetics, P. megacoriacea shows a fairly typical branch HCN profile with decreasing amounts in the older leaves. HCN quantities are low to moderate. |
|
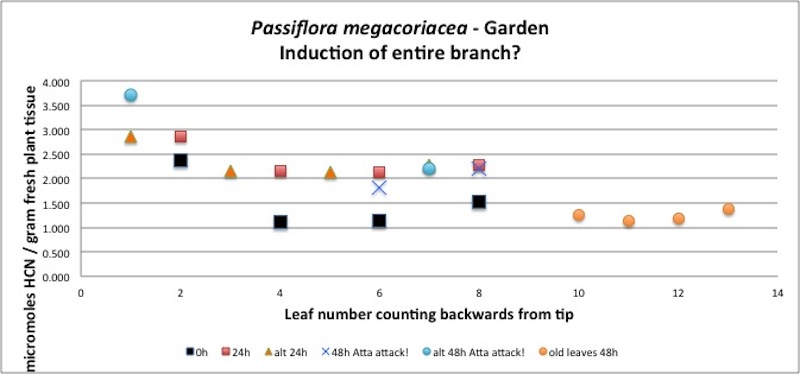 |
| Figure A13, above. While analyzing this branch of P. megacoriacea, leafcutter ants (Atta) attacked during the second night, defoliating some leaves and partly removing others. The 24 and 48 hour HCN values were close to double that of the undamaged plant at time t=0, suggesting induction of cyanogenic glycosides inresponse to damage within 24h. It is important to note that varying concentrations of β-glucosidase enzymes affect the rate of HCN release, but have no effect on the final amount measured. The only exception is if there is no β-glucosidase enzyme at all, in which case no HCN will be measured. |
|
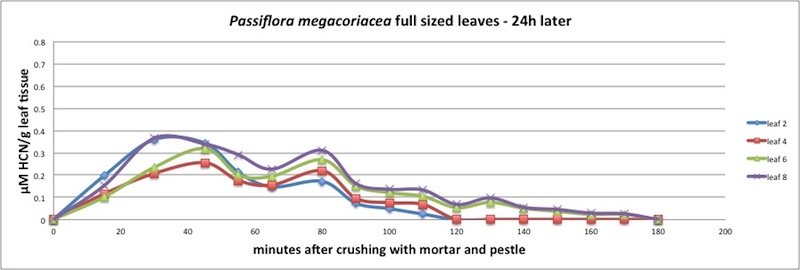 |
| Figure A14, above. HCN release kinetics for P. megacoriacea, 24 h after cutting damage to even-numbered leaves. |
|
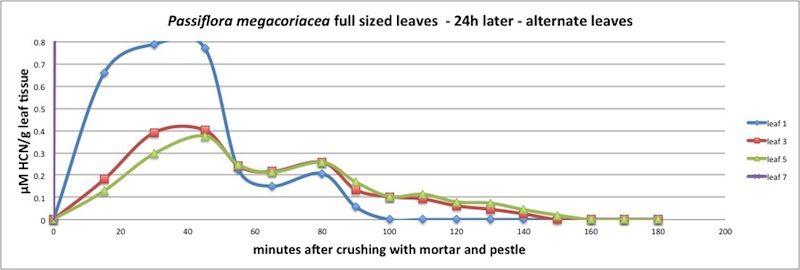 |
| Figure A15, above. HCN release kinetics for P. megacoriacea 24 after cutting damage to neighboring leaves. |
|
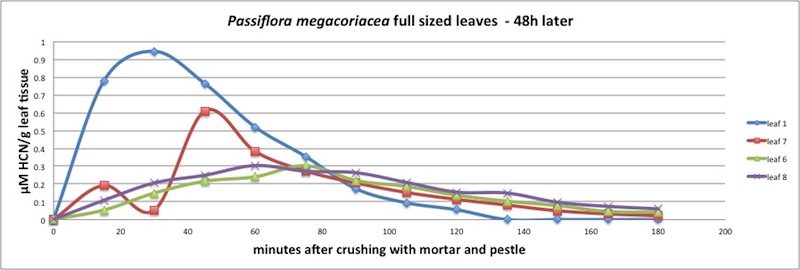 |
| Figure A16, above. 24h later, at time t=48h, after Atta attack. Note that leaves 6,7 and 8 release HCN for a longer time than younger leaves such as leaf 1, 3 and 5. |
|
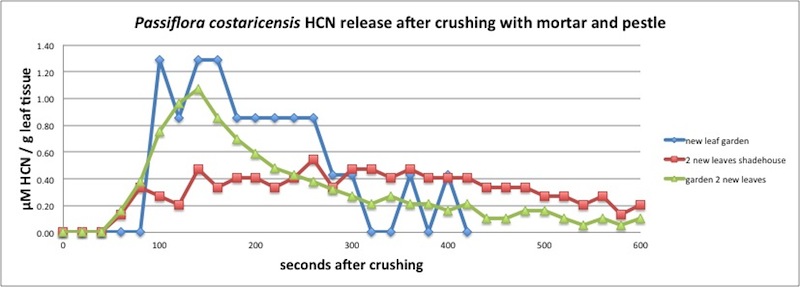 |
| Figure A17, above. P. costaricensis release kinetics indicate a peak averaging around 200 seconds, but with some variation. The red line shows leaves with a slower peak - maybe 300 seconds. Measured in closed container (see Appendix 1). |
|
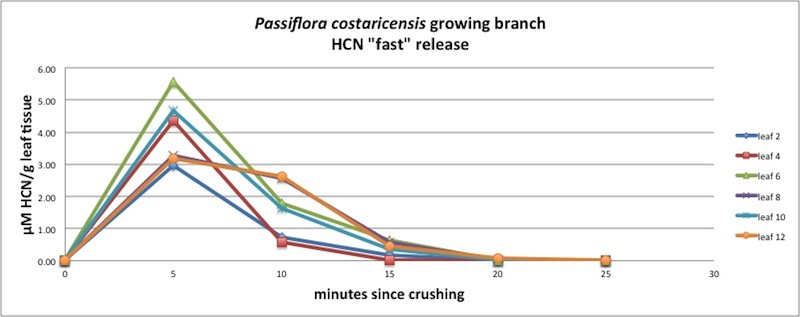 |
| Figure A18, above. This graph also hints at two HCN release patterns, with leaves 8 and 12 showing a slightly delayed release as compared with the other leaves. |
|
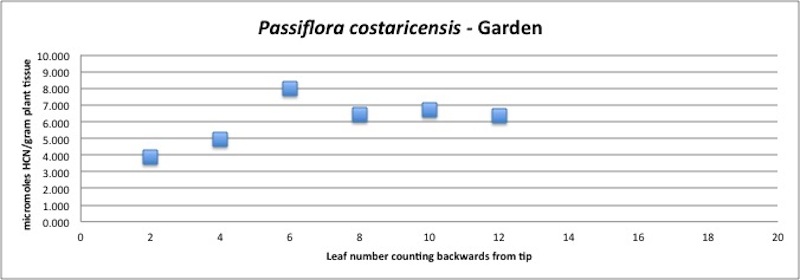 |
| Figure A19, above. HCN branch profile for P. costaricensis. HCN amounts are consistently high. |
|
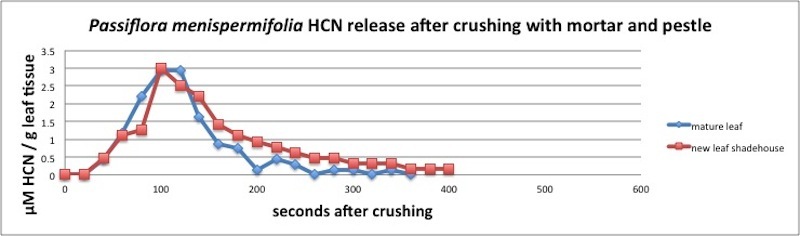 |
| Figure A20, above. HCN release kinetics for P. menispermifolia. HCN release peaks at 100 seconds, followed by an exponential decay. Measured in closed container (see Appendix 1). |
|
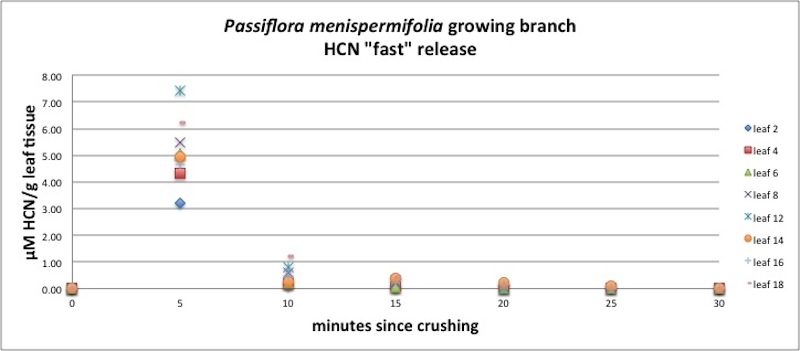 |
| Figure A21, above. Release kinetics for P. menispermifolia leaves along a branch. Note similarity among all ages of leaves. |
|
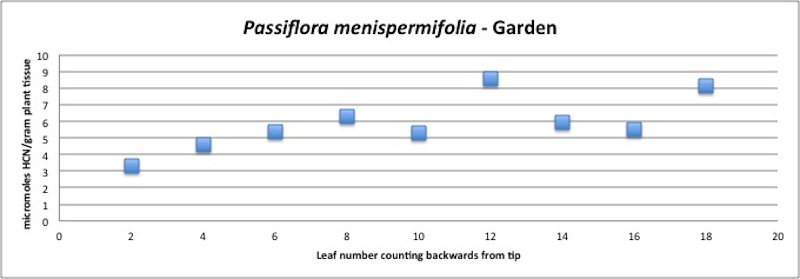 |
| Figure A22, above. P. menispermifolia branch HCN profile. Note consistent high amounts, increasing slightly with leaf age. |
|
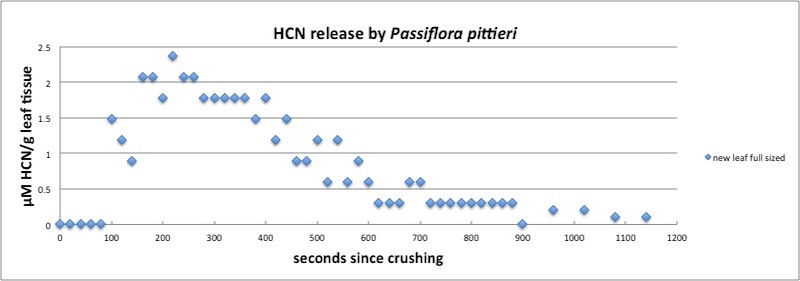 |
| Figure A23, above. Release kinetics for new leaf of P. pittieri. HCN release peaks at around 250 seconds followed by a slow decay ending after about 20 minutes. Measured in closed container (see Appendix 1). |
|
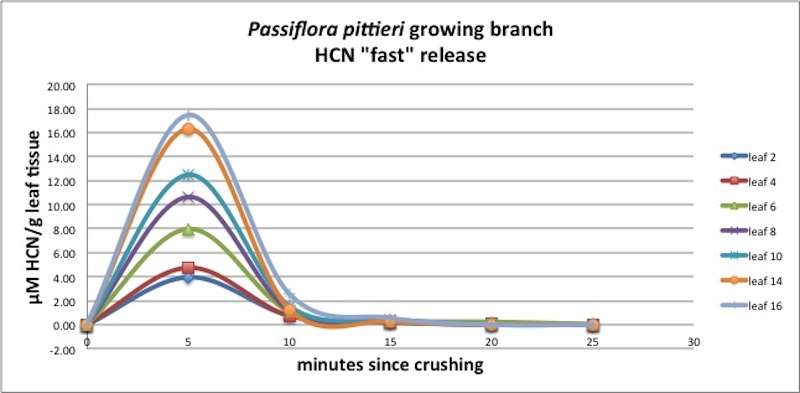 |
| Figure A24, above. HCN release kinetics for leaves growing along a P. pittieri branch. Note similarity of young and old leaves. |
|
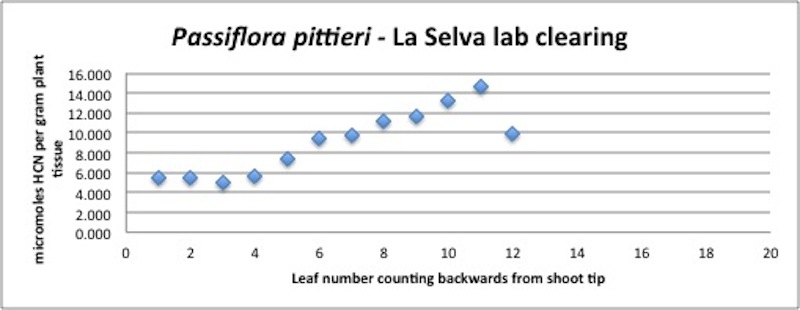 |
| Figure A25, above. P. pittieri branch HCN profile. P. pittieri consistently releases high amounts of HCN, increasing as the leaves age. Note that this entire branch grew extremely rapidly (within a month), and that the differences in leaf ages are very small. This growth pattern is very typical of P. pittieri. |
|
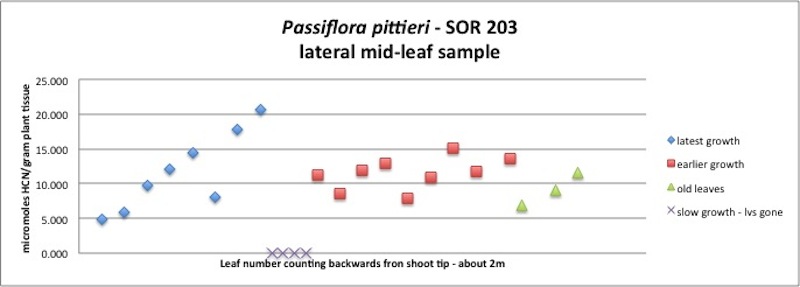 |
| Figure A26, above. A complex of three P. pittieri branches, each one growing out of the other. The first 8 leaves illustrate the pattern in Figure A25, with increasing HCN as leaves age. The second branch is all mature, older leaves, maybe 6 months old, showing a consistently large amount of HCN. The third branch is all old leaves, over 1 year old, still containing large amounts of HCN. I have also seen three year old leaves persisting in the forest understory on small, but chemically protected plants. |
|
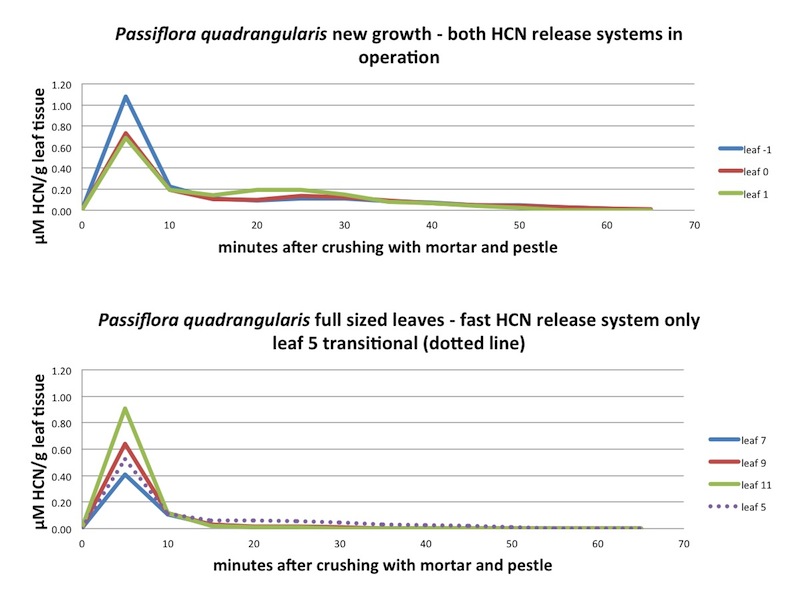 |
| Figure A27, above. P. quadrangularis new leaves exhibit two types of HCN release kinetics: "fast" and "slow". The "slow" kinetics desappear in the older leaves. |
|
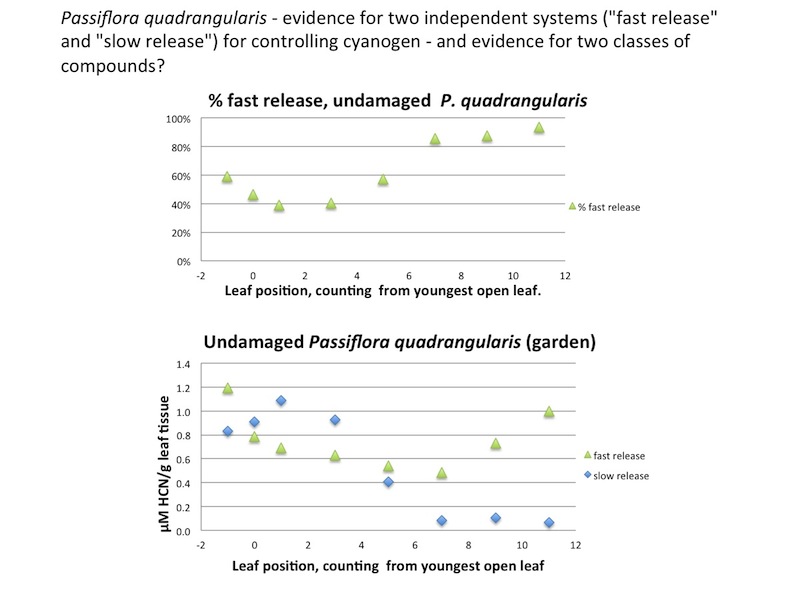 |
| Figure A28, above. Splitting HCN production into "fast" and "slow" components, in undamaged whole leaves, makes it clear that the slow component starts to disappear in leaf 5, and is nearly gone in older leaves. |
|
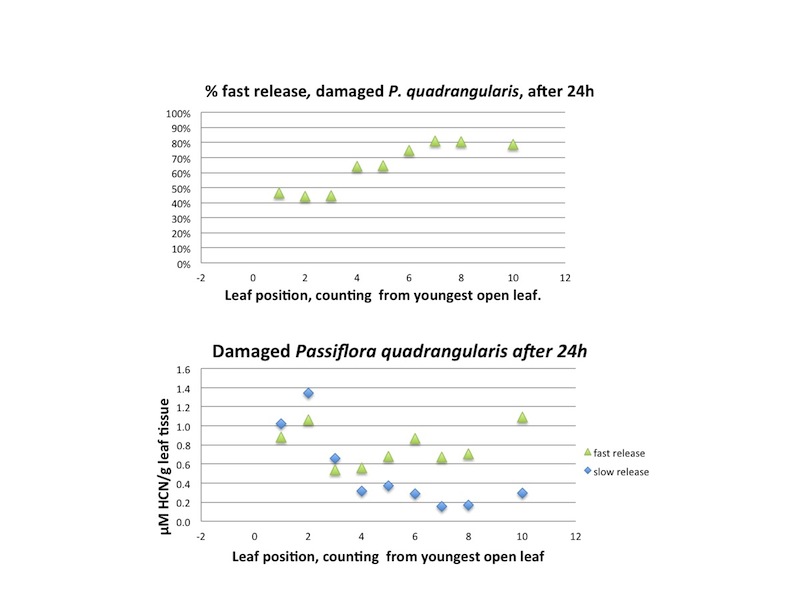 |
| Figure A29, above. Data from same branch of P. quadrangularis as Figure A27 and A28, but 24h later after leaf sample removal. |
|
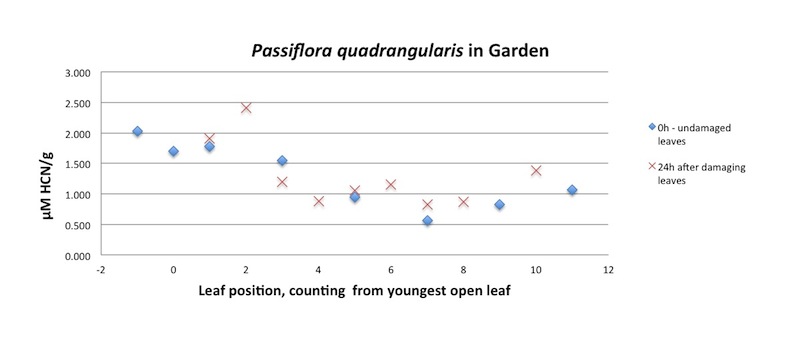 |
| Figure A30, above. P. quadrangularis branch HCN release profile, undamaged leaves (blue diamonds) and 24h later (red X's). There is no suggestion of systematic induction of HCN compounds after cutting damage caused by sampling foliage. |
|
| |