 |
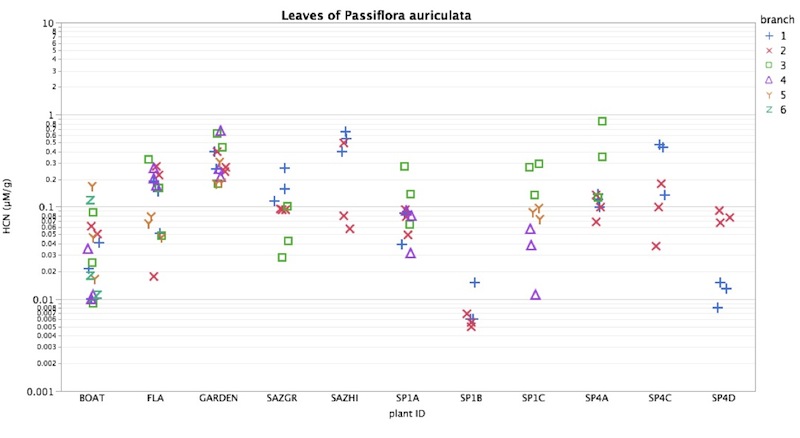
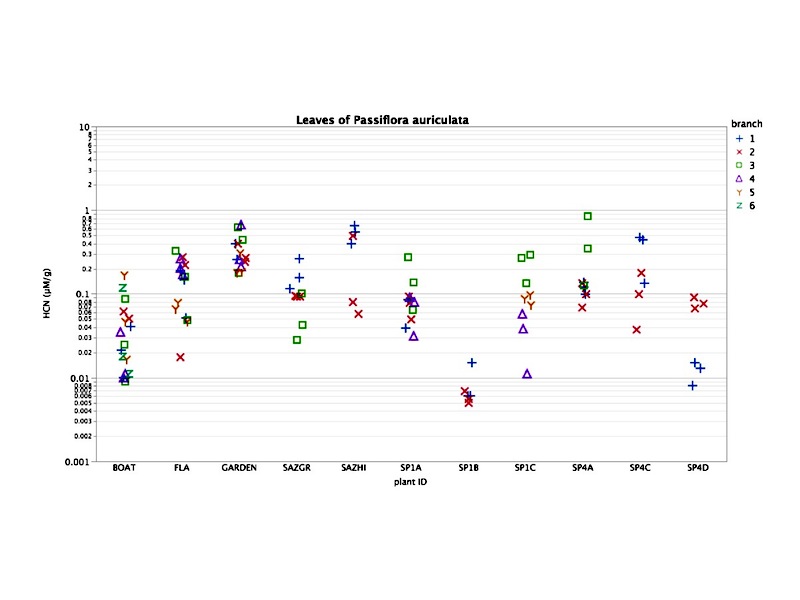
Figure 9a. (above) HCN amounts produced by separate branches (colored symbols) from individual plants listed on x-axis. P. auriculata exhibits large variation in amount of HCN produced, with the greatest value more than 200 times the lowest. Examining the individual plants on the x-axis above, and noting the log scale for the y-axis, it is evident that some plants produce fully 10 times as much as some others (e.g. "garden" vs "boat"). Within each plant, the greatest amount is on average about 10 times the smallest amount. Much of this variation is between branches, with some branches producing more HCN than others. "SP1c" illustrates this with the greatest three readings from one branch (green box symbol), the middle three from another branch (red "Y" symbol) and the lowest three readings from a third branch (purple triangle symbol).
|
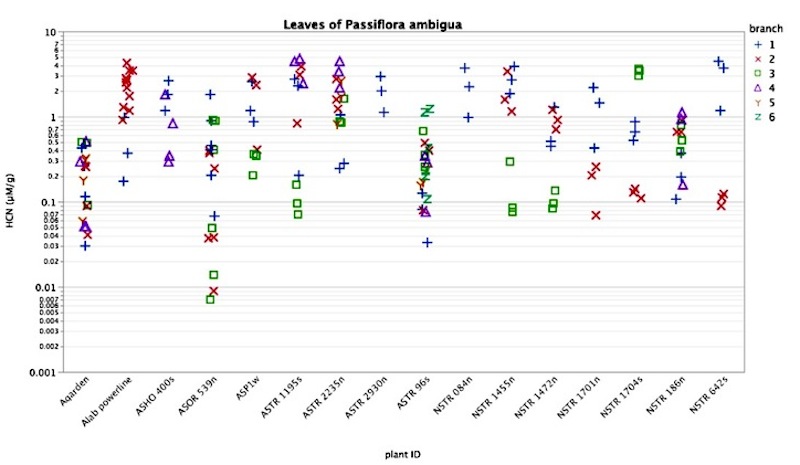 |
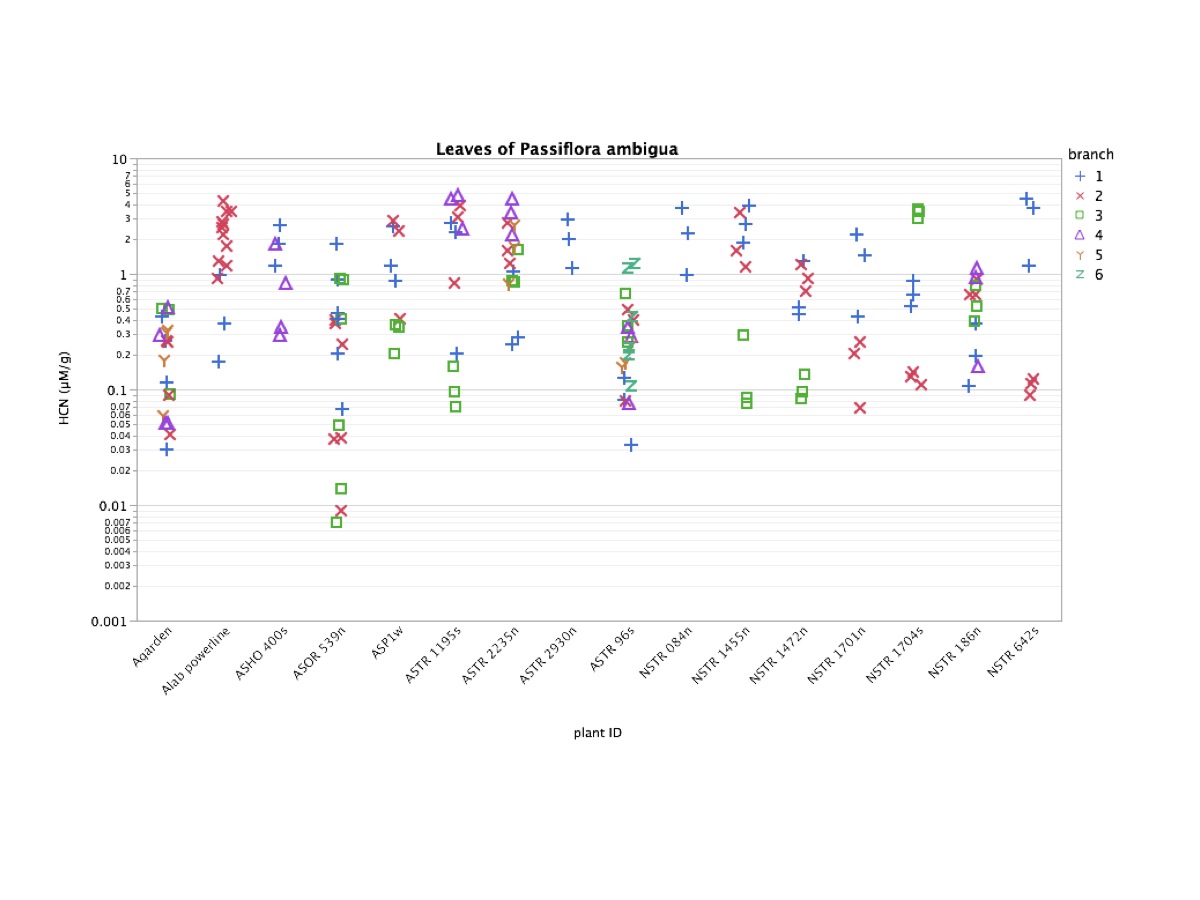
Figure 9b (above). HCN amounts produced by separate branches (colored symbols) from individual plants listed on x-axis. P. ambigua shows a somewhat greater range of values for HCN production as compared with P. auriculata. In this case the variability is greater within each individual plant, with some branches producing large amounts and others much much less. For example NSTR1455n has two very cyanogenic branches and another with barely detectable amounts 40 times less.
|
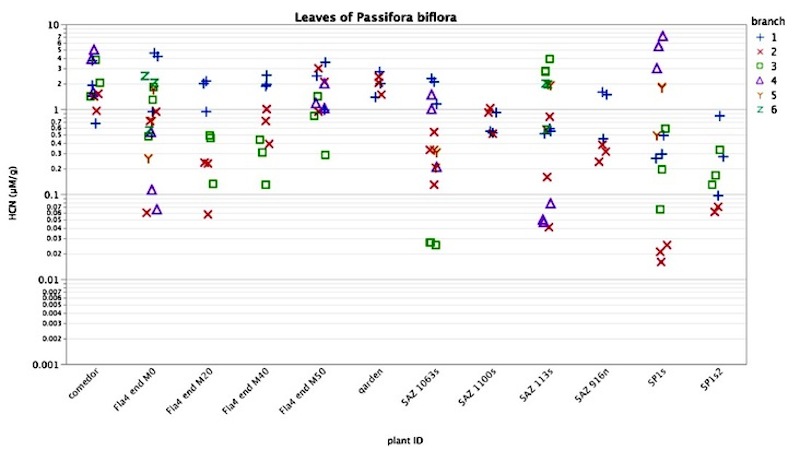 |
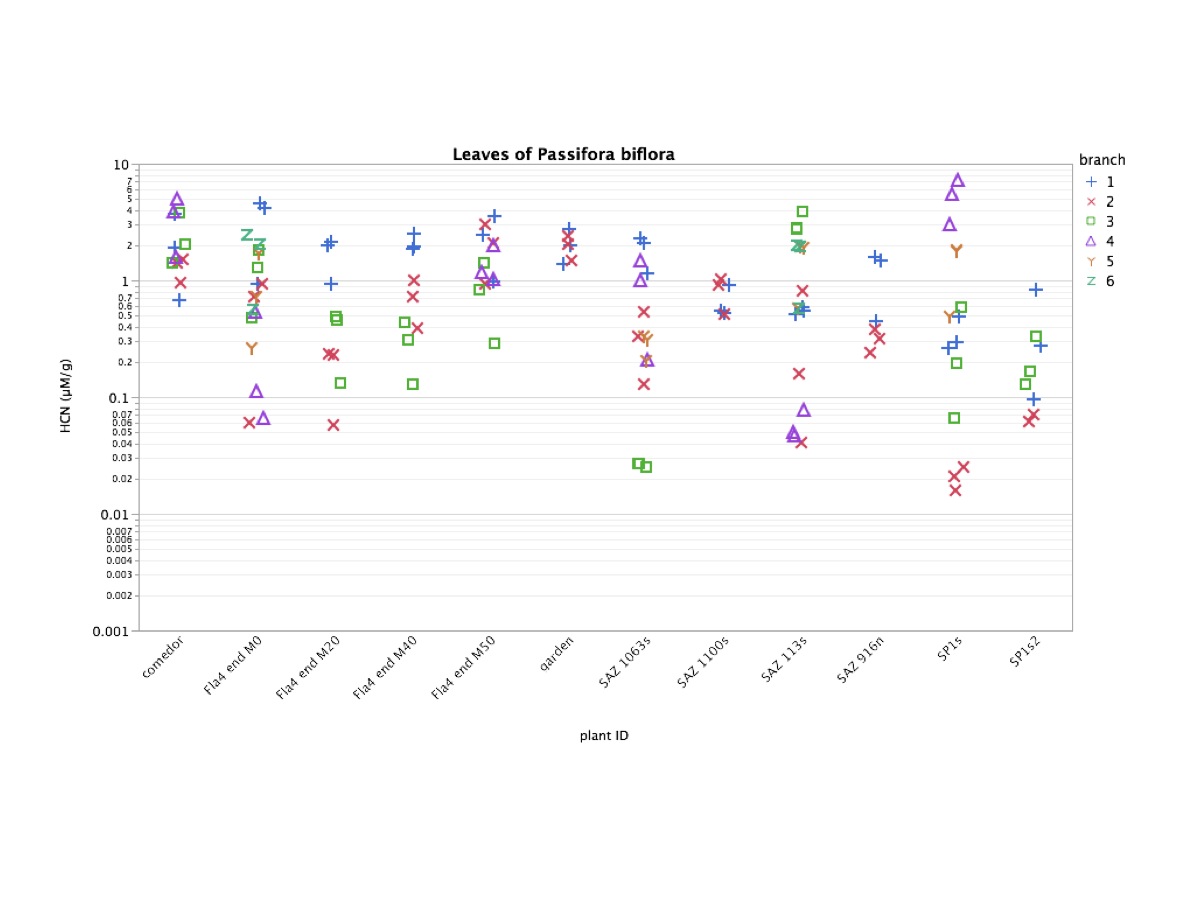
Figure 9c (above). HCN amounts produced by separate branches (colored symbols) from individual plants listed on x-axis. P. biflora also exhibits extreme wide variation in HCN production. In this case the true variability is even greater than that shown above, because I replaced zero values with "lower limit of detection" values which are an inverse function of the sample weight. P. biflora leaves are small and light, reducing detection sensitivity. Values below .1 μM/g are probably insignificant in terms of toxicity.
|
| Figure 9d. (below) Sources of variation (sum of squares) for HCN content (log(μM/g) in leaves of Passiflora |
| Source |
P. auriculata |
P. ambigua |
P. biflora |
| Among individual plants |
15.8*** |
12.9*** |
10.6*** |
| Among branches within plants |
5.2*** |
9.9*** |
25.7*** |
| Within branches |
2.9 |
3.3 |
5*** |
***p<.0001; note: variation slightly underestimated because zero readings were replaced by "limit of detection" (maximum) values. |
|